Solar Tilt Optimizer
Find the best panel tilt (fixed or seasonal) for more kWh.
Project Overview
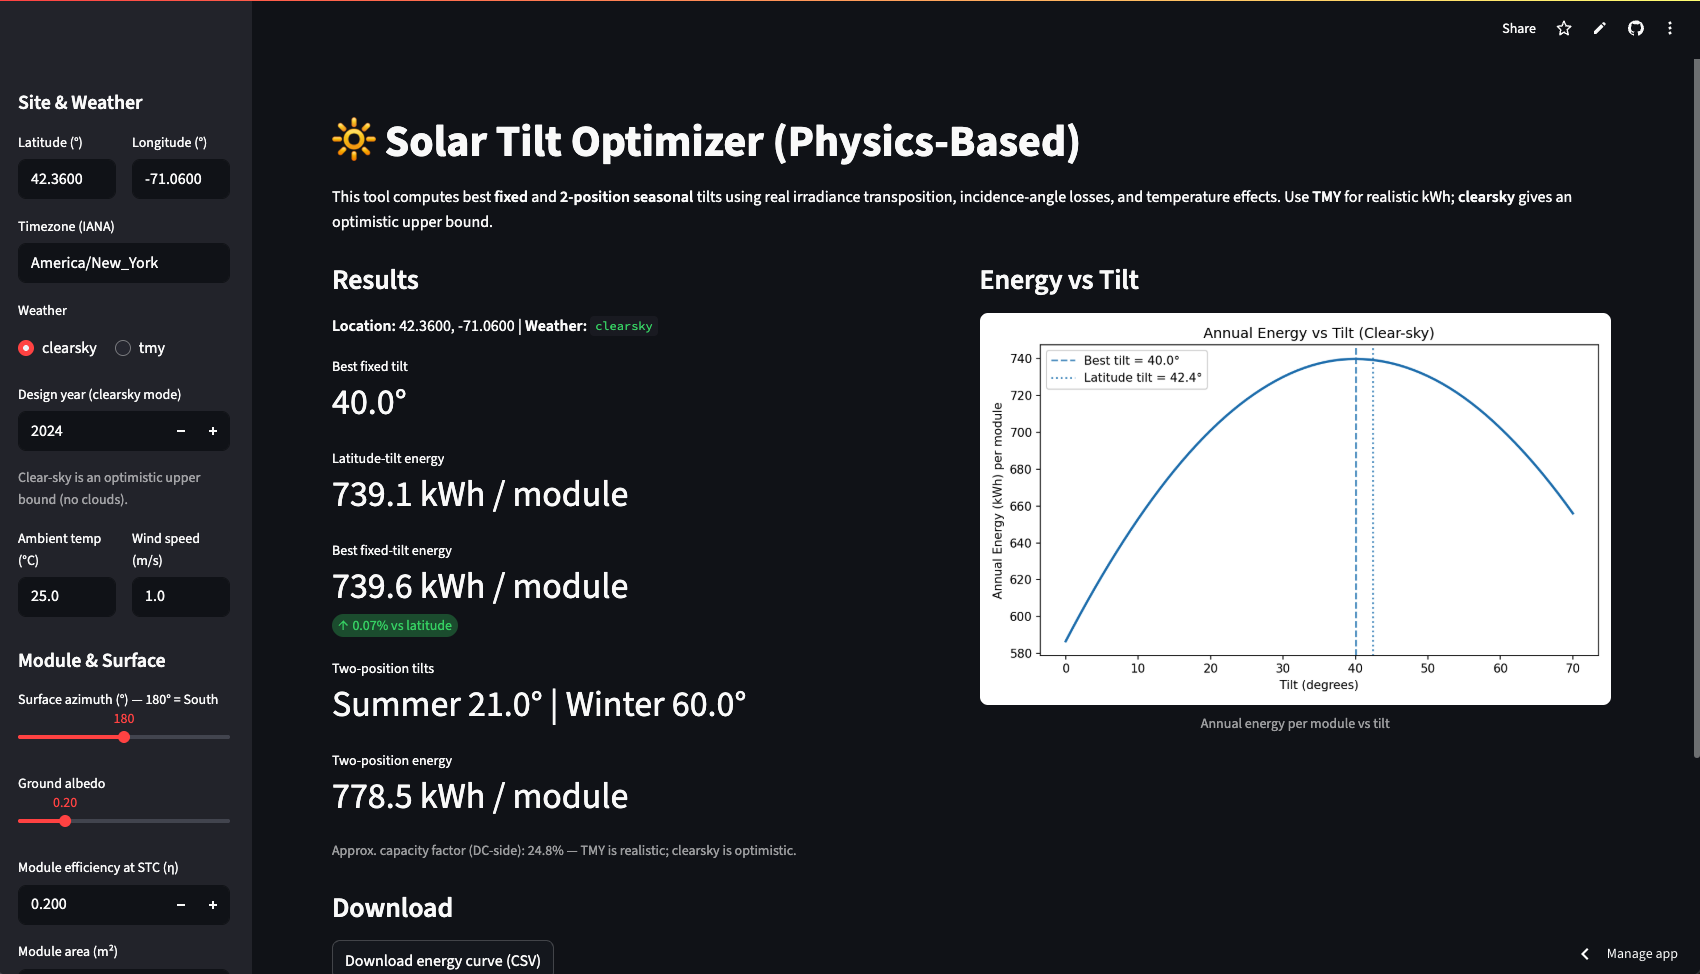
The Solar Tilt Optimizer is a Streamlit app that computes the best fixed tilt and a simple two-position seasonal schedule (summer / winter). It works with realistic TMY weather or quick clear-sky mode and outputs a clean Energy-vs-Tilt plot plus CSV/PNG downloads. Time was allocated to an extensive literature overview, learning many complex yet exciting math and physics concepts related to light and absorption.
How It Works
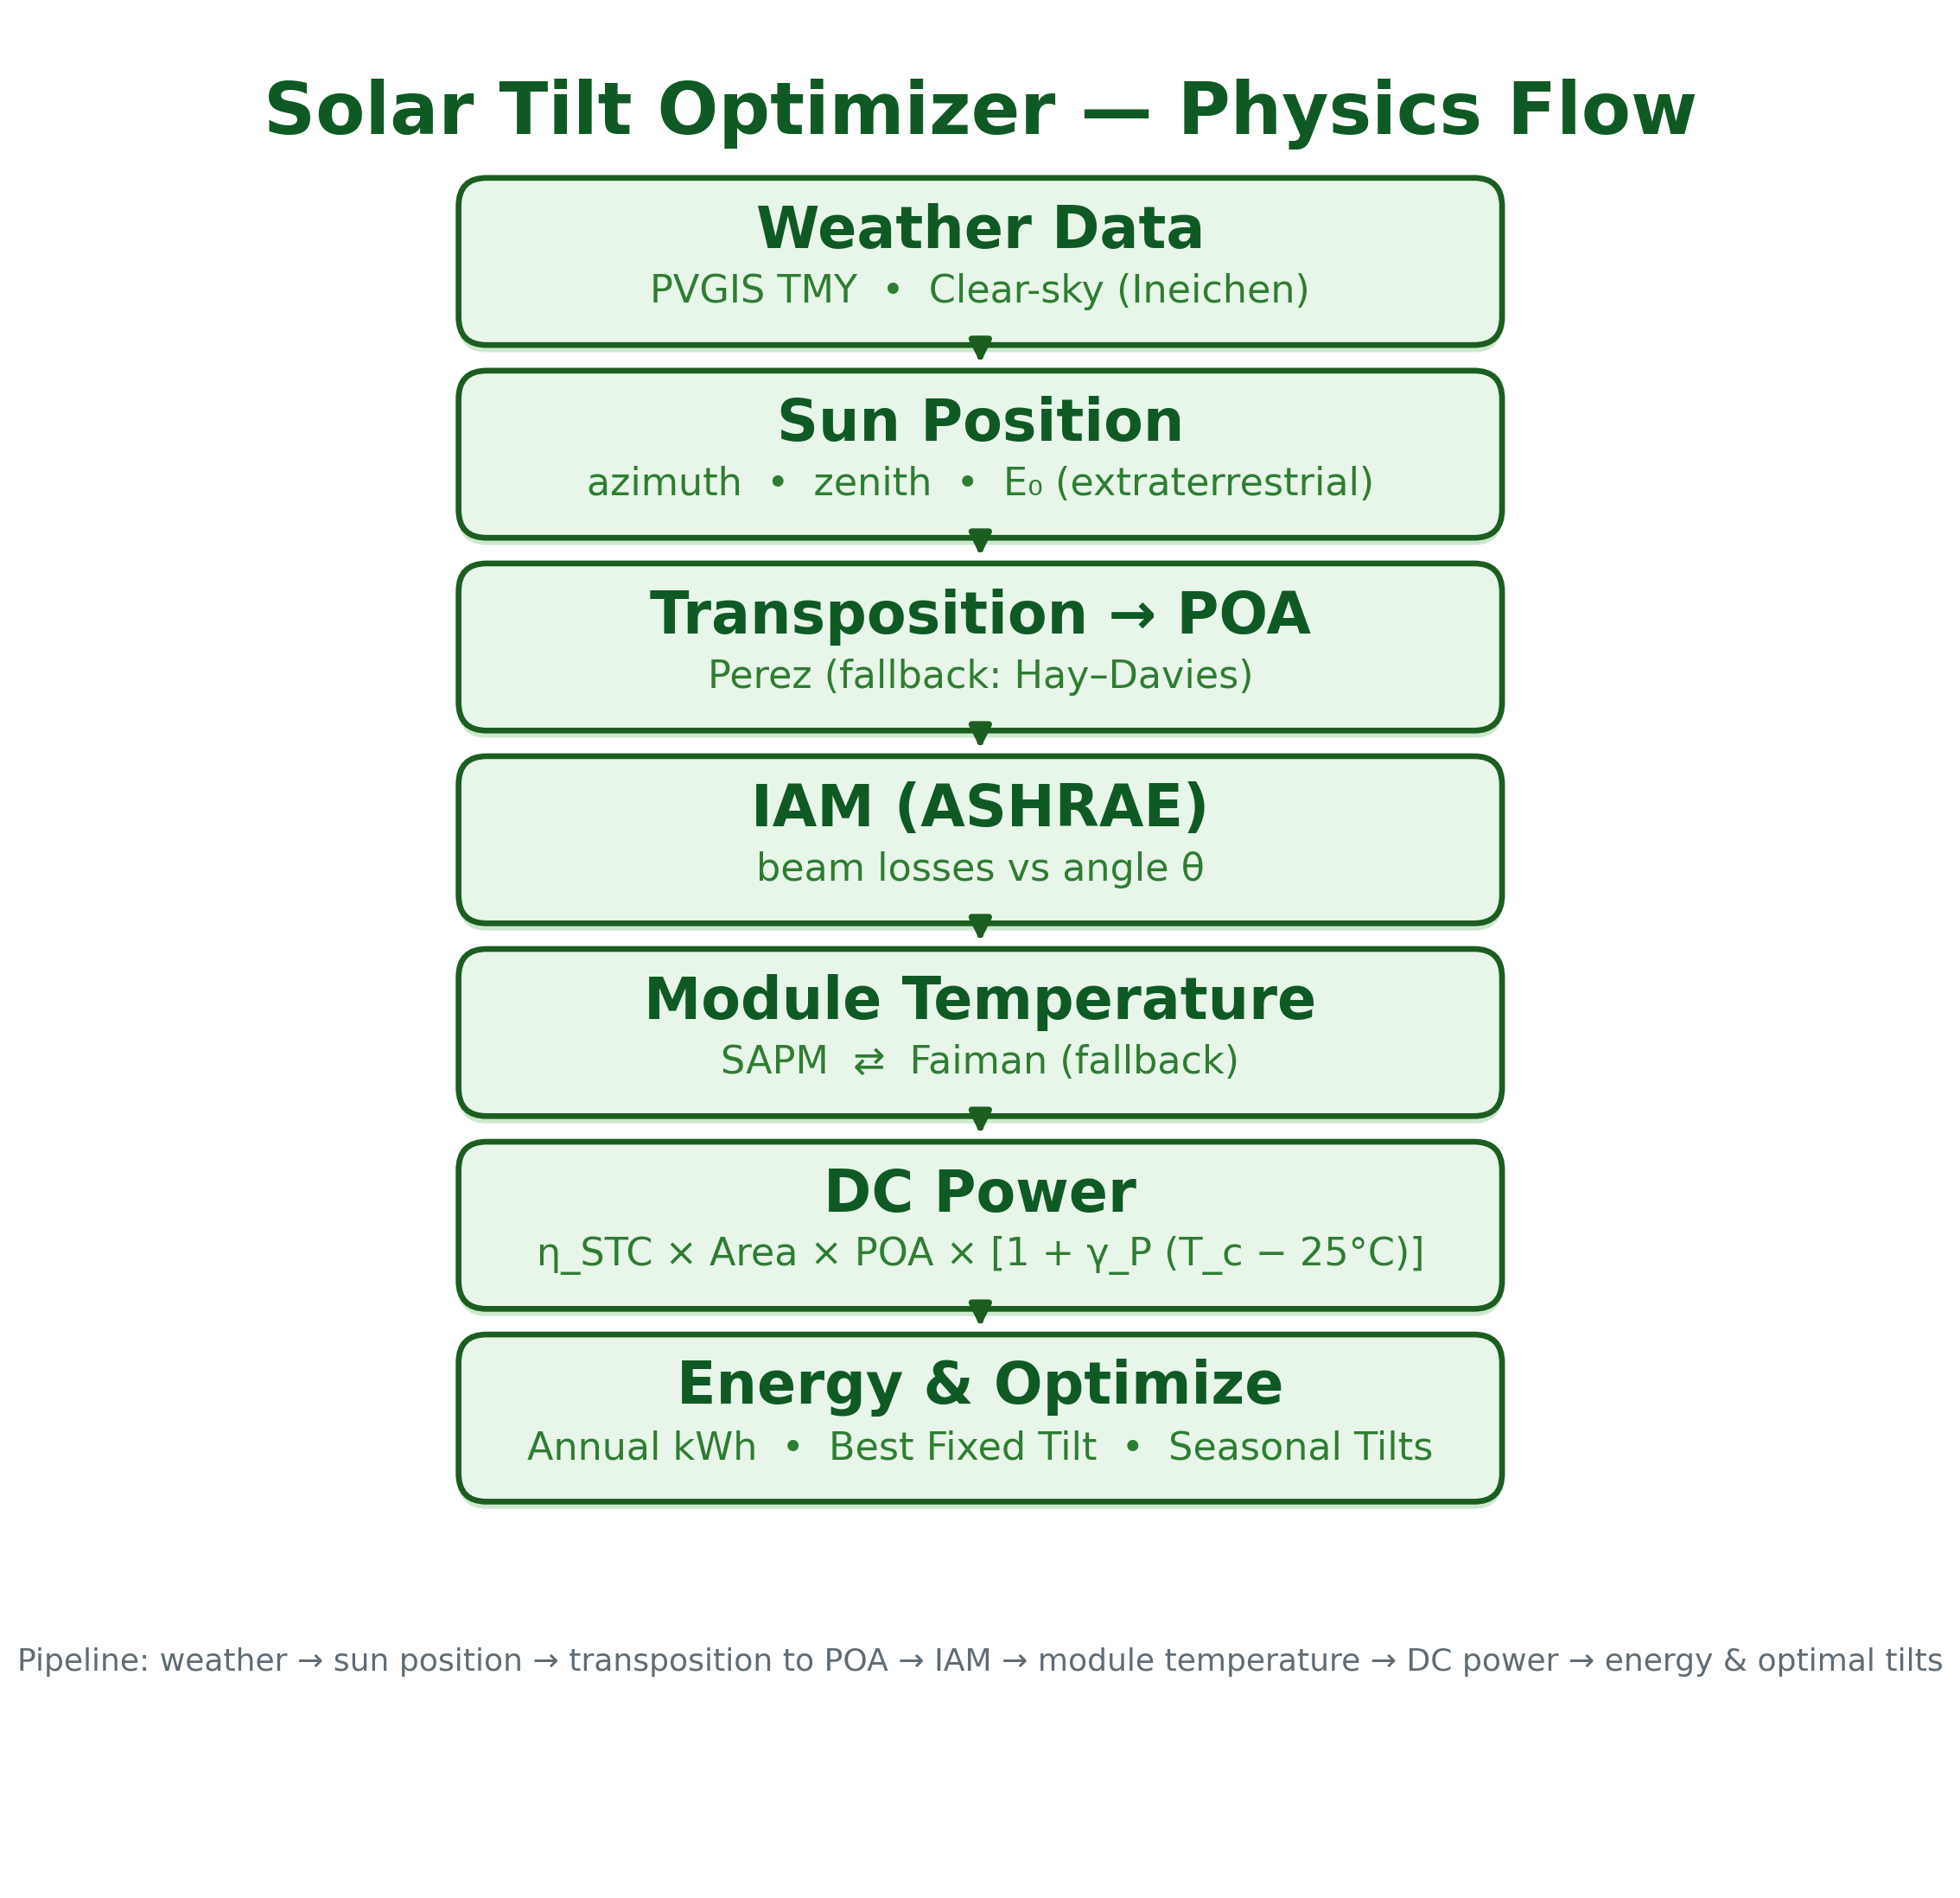
- Weather: Pulls PVGIS TMY for realism or uses Ineichen clear-sky as an upper bound.
- Sunlight on the panel: Transposes beam/diffuse light to the tilted plane (Perez with fallbacks).
- Angle losses: Applies the ASHRAE incidence-angle modifier (IAM) on the beam component.
- Temperature: Estimates cell temperature (SAPM; falls back to Faiman) and reduces power when hot.
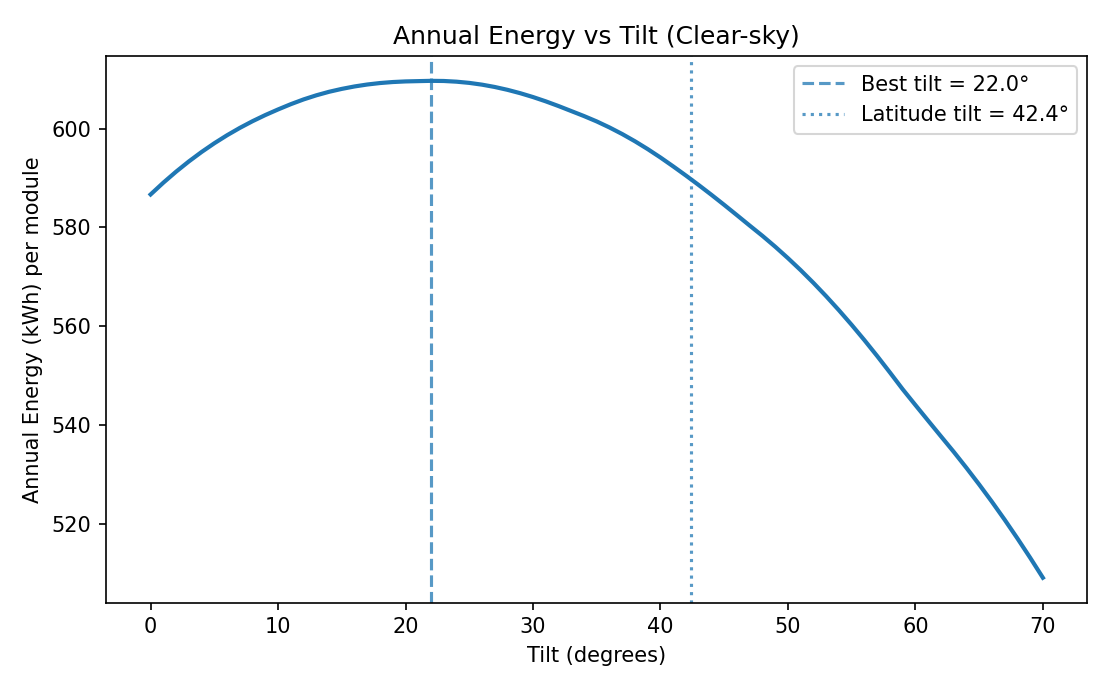
- Search: Scans a grid of tilts and picks the angle(s) that maximize annual energy.
A little math...
In plain terms: EPOA is the sunlight that actually hits the tilted panel (beam × IAM + sky + ground); IAM(θ) shows how oblique angles reduce beam; PDC(t) turns that sunlight into electrical power with temperature losses; and E(θ) sums power over time to find the tilt that makes the most energy.
Environmental Angle
More solar kWh means less fossil generation. If a site gains even 2-4% energy from better tilt, multiply that by thousands of modules and years of operation—those avoided kWh translate into measurable CO₂ reductions.
Next Steps
- Bifacial & rear-side modeling (view factors + albedo seasonality).
- Snow/soiling loss options and roof/racking tilt constraints.
- Batch/API mode for portfolio studies and automatic reports.
Key Features
Fixed & Seasonal Tilts
Best annual tilt plus a two-position summer/winter schedule.
TMY or Clear-Sky
Realistic PVGIS TMY or fast no-cloud upper bound for exploration.
Physics Inside
Perez/Hay-Davies, ASHRAE IAM, SAPM/Faiman temperature, temp-co power.
Ready to Share
Energy curve CSV, plot PNG, and a simple capacity-factor readout.
Project Details
Duration
Oct-Dec 2024
Live App
Impact
Higher kWh from the same array ⇒ lower LCOE & fewer CO₂ emissions—especially meaningful at scale (schools, municipal rooftops, fleets).
Technologies Used
Outcomes
- Best fixed & seasonal tilts in minutes
- Energy-vs-tilt curve & downloads
- Percent-level kWh gains, lower emissions
- Version-robust physics pipeline